Overview of ACME
ACME's functionality is split into two major groups, called Measure and Analyze. As such, the software is split in two panels / tabs.
The Measure tab contains functionality for recording measurements, including a
signal generator and signal monitors. ACME measurements are stored in separate
files and are grouped together in a working folder. The measurements can be
inspected, processed and plotted on the Analyze tab.
important
An ACME session is tied to a folder on your system. When you start ACME,
we recommend to first select a proper folder where the measurements are to be stored.
This is done by clicking in the Menu bar: File->Open measurement folder..., or by > pressing the corresponding button on the toolbar.
Measure tab

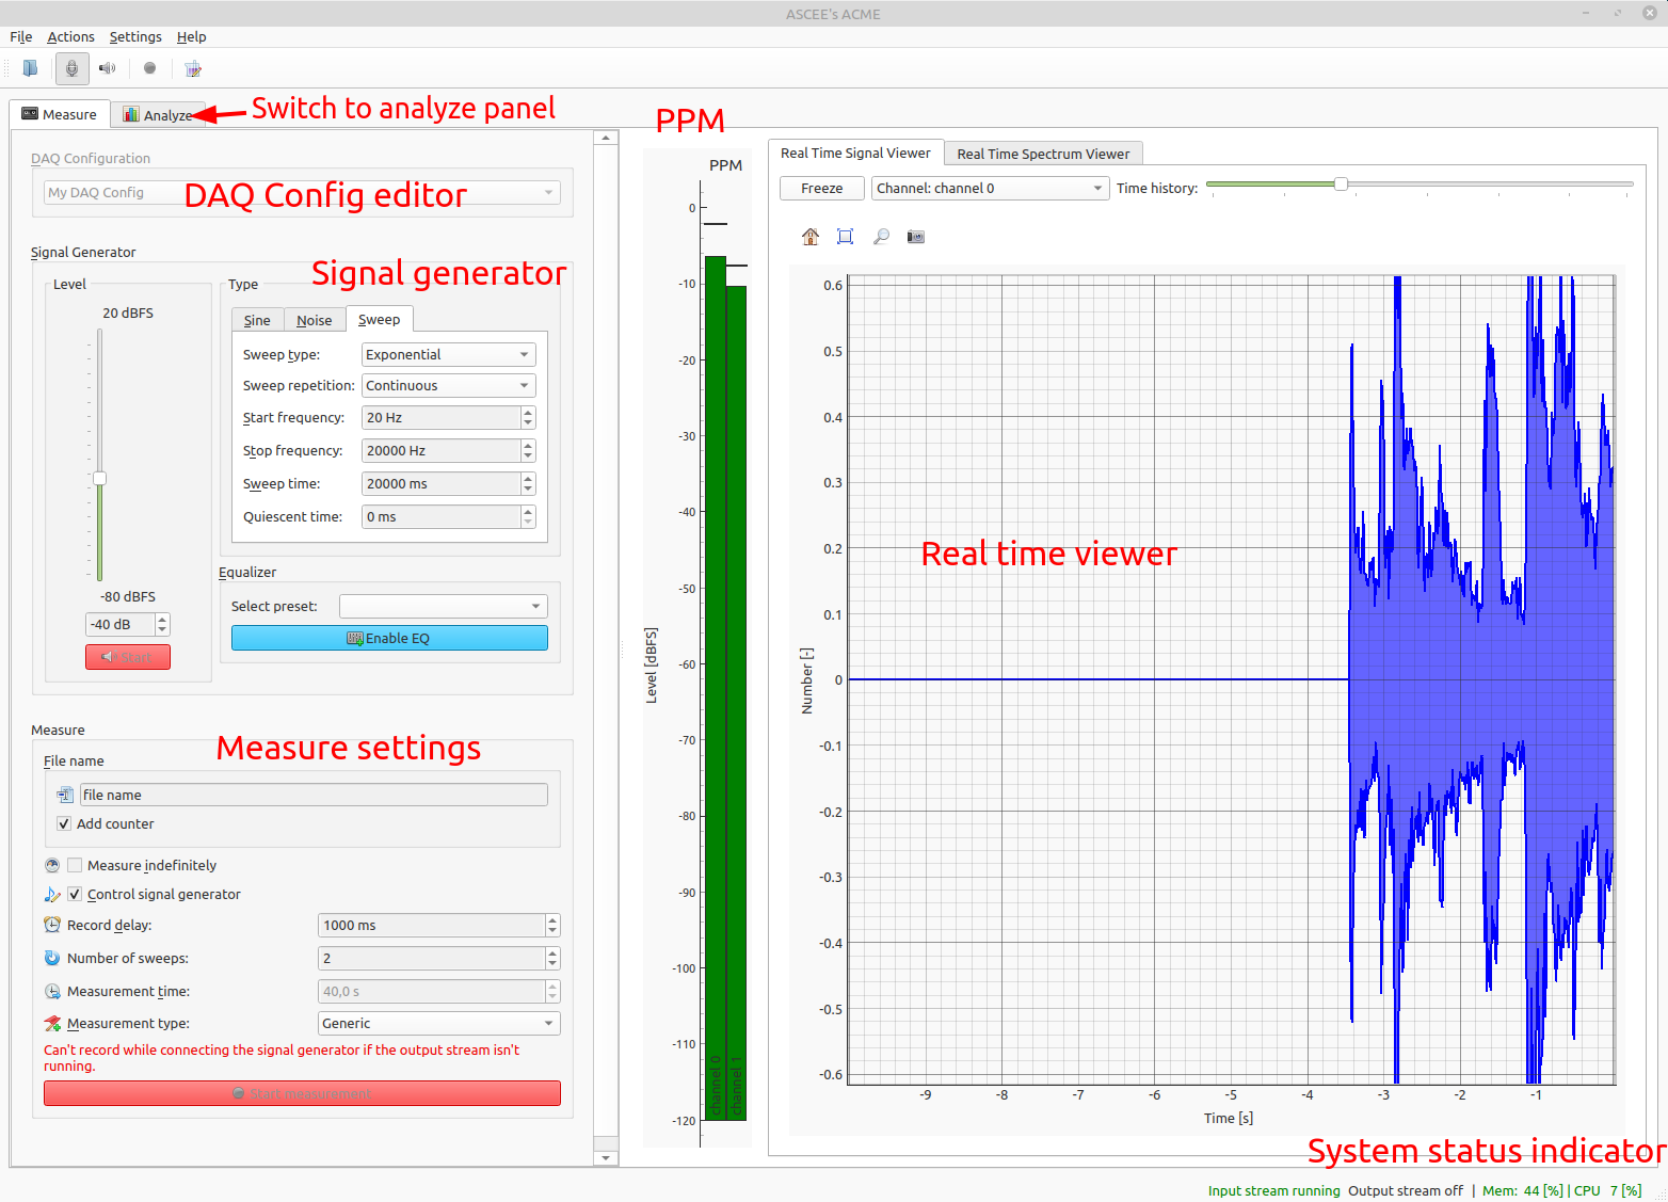
The figure above shows an overview of the Measure tab.
- The DAQ configuration allows editing and configuring the DAQ devices. This
works using presets, which are stored on disk. Presets can be editing by
right-clicking with the mouse on the current configuration. The example above
shows an active configuration called
My DAQ Config - You can switch to the
Analyzepanel by clicking theAnalyzetab. This can be done at any moment, except when performing a measurement. - The
Signal Generatorbox is used to control output test signals. - The
Measurebox is used to configure and perform measurements. - The
PPMshows Peak Programme Meter results, these are instantaneous and peak levels measured on the activated input channels. - The
Real time Viewerhas two tabs and allows for real time investigation of incoming signals. - The
System status indicatoris part of the status bar and shows current CPU and memory usage. If these are too high, values will turn red. This might also lead to buffer under or overruns during a measurement recording.
Analyze tab

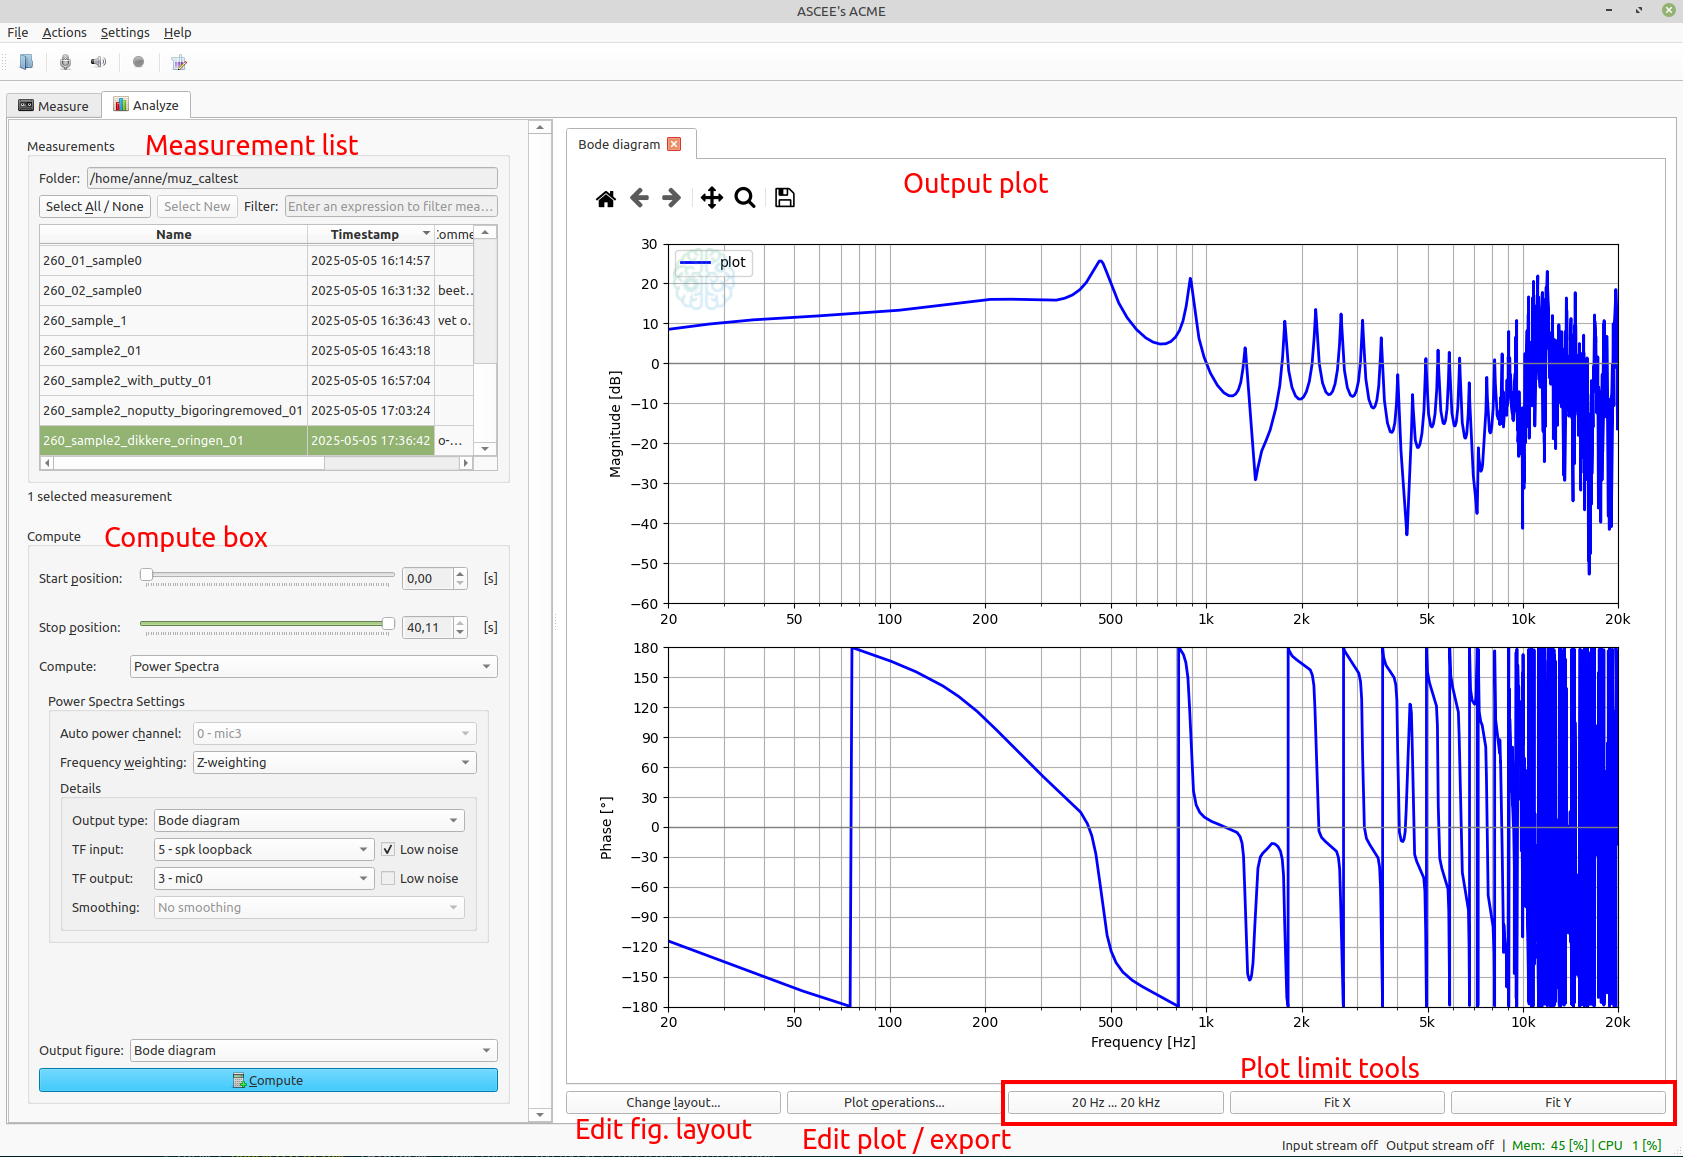
The figure above shows an overview of the Analyze tab.
- The measurement list shows an overview of the available measurement files in
the current folder. The current folder is also used in the
Measuretab, as the place where measurement files are stored. Each measurement file in ACME is self-contained and stores the raw acquired signals. - The compute box shows settings for performing post-processing computations. Post-processing is any task that extracts valuable information from the raw data stored in a measurement. For example, this can be the computation of sound levels, power spectra and insertion loss.
- The figure shows computed results in a plot. Multiple results can be added in the same plot if they are compatible.
- Figures can be annotated / marked up using the layout options. Lines can be
hidden, edited and legend labels can be changed using the
Plot operations...button. The dialog that opens with this button also allows for exporting the result data.
DAQ device support
As data acquisition, ACME supports all sound cards through the OS provided APIs:
- PulseAudio / ALSA on Linux,
- WASAPI / ASIO / DirectSound on Windows,
- DT9837A USB DAQ.
Through ACME's backend-independency, we strive to support multiple DAQ devices around. If you would like ACME to support a device we currently do not yet support, please contact us and we will discuss the possibilities.
µZ Impedance tube
ACME is the required software for performing measurements with the μZ impedance tube. See the product page and section in the user guide for more details.