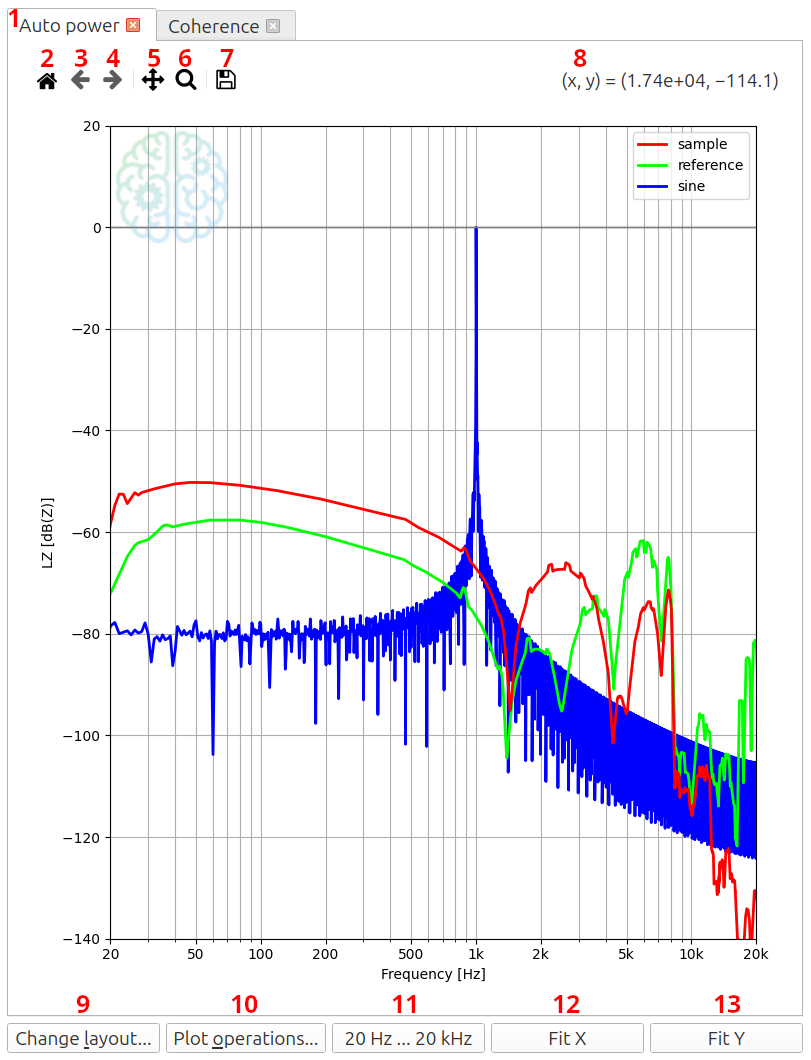
Plot
The plot area is located on the right side of the Analyze tab.
- Tabs for each figure
- Reset axes
- Undo
- Redo
- Move
- Zoom
- Cursor position
- Change layout
- Plot operations
- Save (image)
- Preset for x axis
- Fit x axis to data
- Fit y axis to data
- Undo closing the last figure — stores up to 10 figures

Some options are not available if no figure is present.
The preset button 20 Hz ... 20 kHz is only available on a logarithmix x axis.
Legend
The legend automatically tries to find the location where it leaves a clear sight on the plotted lines. It can be manually dragged to any other position or disabled in the menu Change layout. If more than 20 lines are visible simultaneously, it is disabled.