Power spectra
Power spectra computes the frequency domain data of the measurement.
Output type
The following output types are available:
- Auto power
- Bode diagram
- Signal coherence
- Transfer magnitude
- Transfer phase
They are further explained below.
Auto power
Auto power shows the average spectral content of channel Auto power channel.
It is the sum of the positive and negative frequencies, so the plot shows the
total signal power at this frequency bin. This corresponds to what a sound
level meter would do. The power is plotted on a logarithmic (dB) scale, with a
reference depending on the type of signal.
- For acoustic pressure, the reference is 20 µPa.
- For voltages, the reference is 1 V.
- For unscaled numbers, the reference is the rms level of a sine wave with unit amplitude, which is .
here are some examples / properties of these definitions:
- Assuming no spectra leakage and a rectangular window, an unscaled sine wave with an amplitude of 1.0 will have an auto power of 0 dBFS ("decibel full scale").
- An acoustic wave with an amplitude of 1 Pa rms, will show up with an overall level of 94 dB SPL.
- An acoustic sine wave with an amplitude of \sqrt{2} Pa, will show up with an overall level of 94 dB SPL.
- For white (Gaussian) noise, represented as unscaled numbers with variance of 1.0 and zero mean, up to the Nyquist frequency has an expected overall signal power of 1.0, and 0.0 above the Nyquist frequency., Therefore the expected auto power in each frequency bin . Therefore computed level in each bin is: = dBFS.
Note that due to this, for broadband signals the height of the auto powers in the spectrum depend on the frequency resolution: the higher the frequency resolution, the lower the levels. On the other hand, for narrow band signals, the height of the peaks are more / less independent on the frequency resolution.
To compute the signal auto power, select the right measurement(s) in the
Measurement List, select the Auto power channel, frequency weighting and
possible smoothing:
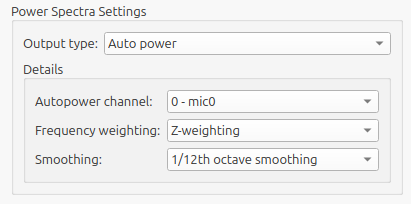
Ten press Compute.
Bode diagram
This type plots both the estimated magnitude and phase of a transfer function between two channels.
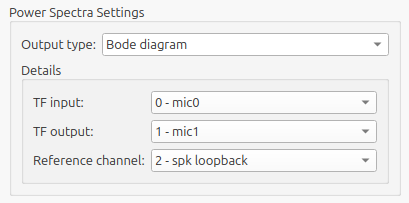
The transfer function is taken from Input channel to Output channel. For
best performance, set Reference channel to the channel with the lowest noise.
See 'Reference channel' below for more information.

Signal coherence
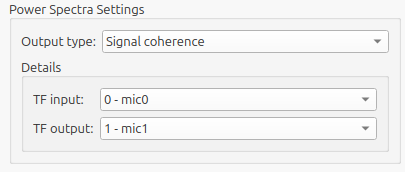
The coherence between two signals is useful to check the signal to noise ratio and linearity. A value of 1 represents perfect coherence (the signals are perfectly related) and a value of 0 represents completely uncorrelated signals. The signal coherence is defined as:
where is the cross-power spectrum estimate from channel to channel .
note
The signal coherence depends on the FFT length, as set in the FFT settings. It should not be taken as an absolute measure.
Transfer magnitude
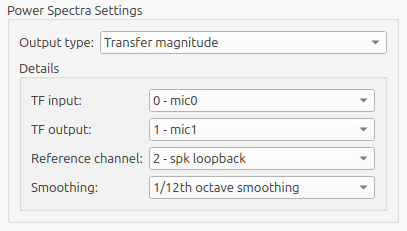
This is the magnitude part of the Bode diagram.
Additionally, Smoothing is available.
Transfer phase
This is the phase part of the Bode diagram.
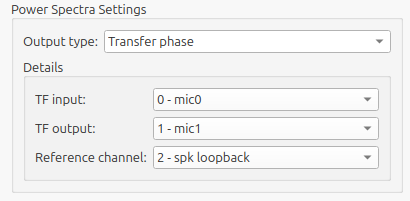
Options
- Auto power channel
- Frequency weighting
- Input channel
- Output channel
- Reference channel
- Smoothing width
Start by selecting the Output type. Depending on the choice, some items are greyed out.
| Auto power | Bode diagram | Signal coherence | Transfer magnitude | Transfer phase | |
|---|---|---|---|---|---|
| Auto power channel | ✓ | ||||
| Frequency weighting | ✓ | ||||
| Input channel | ✓ | ✓ | ✓ | ✓ | |
| Output channel | ✓ | ✓ | ✓ | ✓ | |
| Reference channel | ✓ | ✓ | ✓ | ||
| Smoothing width | ✓ | ✓ |
Auto power channel
This is the channel for which the auto power is computed.
Frequency weighting
Human hearing is less sensitive at low and high frequencies. Moreover, the frequency sensitivity depends on the level of the sound source as well. Frequency weighting can be applied as a coarse representation of that. The weightings are according to the IEC 61672:2003 standard.
- A: A-weighting
- C: C-weighting
- Z: no frequency weighting
Input channel & Output channel
Some Output types work on two channels. The types Bode diagram,
Transfer magnitude and Transfer phase describe a transfer function from
Input channel to Output channel. The output type Signal coherence also
requires two channels, but it does not matter which one is assigned to
Input channel and which to Output channel.
Reference channel
Computing a transfer function between Input channel and Output channel is
most accurate if ACME knows what channel is lowest in noise. This can be
another channel alltogether. If the signal generator is used to perform the
measurement, a low noise channel with the lowest noise is obtained by looping
back the output to another input channel. Set the Reference channel to this
loopback channel. If the signal generator is not used, then the lowest noise
channel usually is the Input channel.
Smoothing
Smoothing makes the graph easier to read, by removing details. It is only
available on output types Auto power and Transfer magnitude. As power
spectra are about the frequency domain, the data are always plotted on a
logarithmic x axis. Fractional octave smoothing has been chosen to keep the
window width visually constant.
warning
Smoothing changes the absolute levels, and thereby change the overall signal power. If smoothing is applied, the overall signal power (obtained by summing up the power in each frequency bin) is no longer accurate.