Sound level meter - statistics
The sound level meter - statistics computes the sound levels within octave or third octave bands. It operates on one channel and takes the statistics across the whole measurement time. Three statistics are available:
- Peak sound level (Lpk)
- Maximum sound level (Lmax)
- Equivalent sound level (Leq)

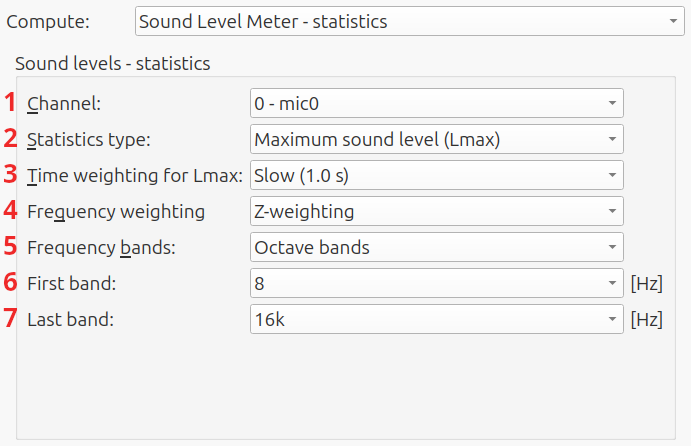
- Channel: channel to take the statistics of
- Statistics type: Lpk, Lmax or Leq
- Time weighting for Lmax: smooth out peaks; only applies to Lmax
0.1 ms; Fast (0.125 s); slow (1 s); 10 s - Frequency weighting: A, C or Z
- Frequency bands: octave or third octave
- First band: limiting the number of bands helps to keep the figure easy to read
- Last band:
Peak sound level (Lpk)
This is the strongest sound anywhere in the measurement, without time weighting to smooth out short peaks. Even though there is no time weighting, the bandpass filters for each band still mean that there is no instantaneous reaction to a short peak, especially at the lower frequency bands.
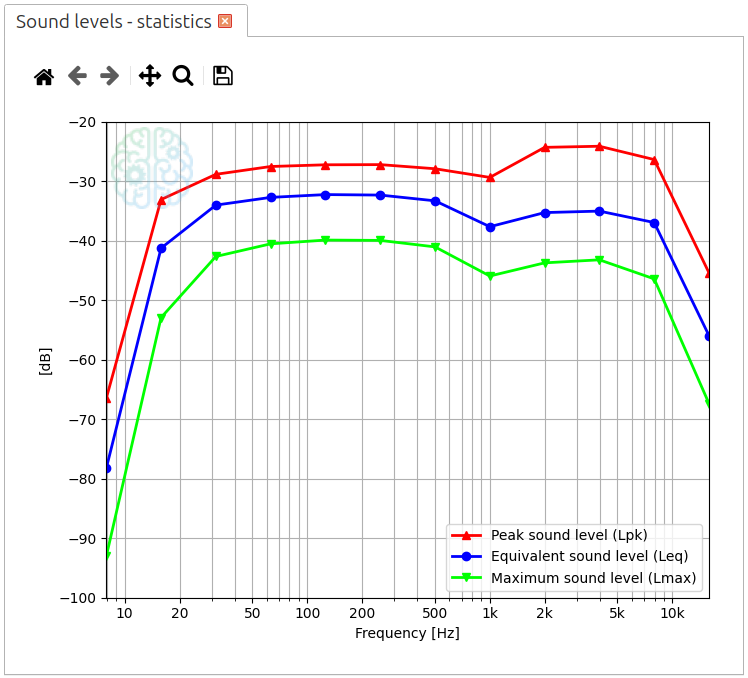
A sine wave has an Lpk of 3 dB above Lmax or Leq.
Maximum sound level (Lmax)
This is the strongest sound anywhere in the measurement, with time weighting to smooth out short peaks.
note
The time weighting filter requires run-in time. The result is only correct if the measurement time is much longer than the time weighting.
Equivalent sound level (Leq)
This is the average power. It can be viewed as the level that a sine wave would have, to have the same average power as the measuement.
Example
An example plot with all three statistics is shown below.
