Computing results
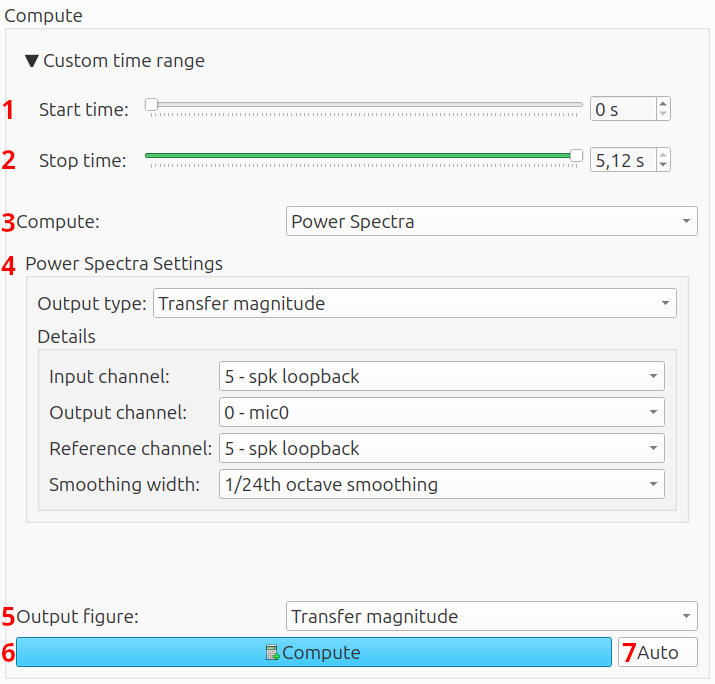
The computation settings are located at the bottom left of the Analyze tab.
They contain the following items:
- Start time: select from which point the data should be processed - will be set to the start of the signal by default.
- Stop time select up to which point the data should be processed - will be set to the end of the signal by default
- Compute: choose what to calculate
- Compute-specific settings: the contents of this sub-menu depend on what has been chosen at
Compute - Output figure: select in which figure the results should be plotted.
- Compute button: press to calculate and plot
- Auto compute: automatically compute future measurements

Start and stop position
The start and stop position select what part of the measurement is to be processed. Usually, they can be left at their default values, which uses the whole measurement. This option is disabled if multiple measurements with different lengths are selected.
Compute
This setting determines what is calculated. It offers the following options:
- Sound level meter - statistics
- Sound level meter - time dependent
- Power spectra
- Insertion loss
- µZ tool1
These options are further described in their respective sections.
Output figure
The option Output figure sets where the calculated result should be plotted. A result can be plotted in a new figure, or in any compatible existing figures. A figure is compatible if it has the same axes (with or without phase) and contains similar data, of the same quantity. For example, it is not possible to plot sound levels and a waveform in one figure.
Auto compute
If you are performing many similar measurements and want to inspect them on the go, ACME can plot them automatically. This function is enabled with the Auto button.
note
Before using the auto compute functionality, at least one measurement must be plotted manually. This selects the right settings. After that, ACME continues using the same settings.
The procedure is as follows:
- Perform a measurement
- Go to the
Analyzetab - Select the right computation settings
- Click
Compute - Enable auto compute by pressing the
Autobutton - Go the the
Measuretab - Perform other measurements
- Future measurements will automatically be plotted
If ACME is restarted or if the DAQ configuration has changed, the channel configuration could have changed. The change could make the computation settings invalid. For that reason, auto compute will be disabled. Manually plot one measurement and click the Auto button to re-enable auto compute.
-
The
µZ toolis only available if the µZ module has been purchased. ↩