Selection guidelines
note
These selection guidelines are only relevant for series impedance measurements. For all other measurements the 4 microphone mode should be used.
Each of the configurations described in the previous sections has its benefits and drawbacks. As a result, which is the optimal configuration will depend on the properties of the sample under test and, in some cases, the frequency range of interest. The performance of the system depends on several factors, most notably the material properties of the sample, the sample dimensions and the size of the back cavity. The influence of the sample dimensions is most complex, since they affect both the impedance of the sample, and of the µZ system itself. After all, the sample holder disk is not part of the sample, but does have a hole that matches its dimensions.
Due to the complex dependencies, it is not possible to give a straightforward recommendation for which configuration to use for a certain sample size, or type of material. The user will generally have to find the best configuration for a certain sample empirically. However, some suggestions for which configuration to start with and how to select the right configuration based on collected measurement data are given below.
note
For samples with large impedance variations across the frequency spectrum, it is possible that different frequency ranges each have a different optimum configuration. But usually, one configuration will do for the whole range.
Selection procedure
The selection method consists of the following steps:
- Select an initial configuration
- Perform a series impedance measurement
- Assess the quality of the measurement results
- update the configuration choice if required
1. Select an initial configuration
The most suitable initial configuration depends on properties of the sample under test. More specifically, these are:
- Sample dimensions
- Material properties
Sample dimensions
For the sample dimensions, only count the active area of the sample, so excluding any adhesive edge. The dimension listed in the table below is the hydraulic diameter, which is defined as:
where is the cross-sectional area of the sample and is its perimeter. The hydraulic diameter of a circular sample is equal to its actual diameter. For a rectangular sample with sides and the hydraulic diameter is:
The suggested configurations for certain ranges of sample size are listed below:
| Hydraulic diameter (mm) | Suggested configuration |
|---|---|
| ≥ 5 | 4 microphone |
| 1...5 | 5 microphone (0.5 cc) |
| < 1 | 5 microphone (0.1 cc) |
Material properties
If the material properties are known, or certain properties are expected, this can be taken into account in the configuration selection. A general, qualitative guideline is listed below:
| Series impedance | Sample material properties | Suggested configuration |
|---|---|---|
| low | open, low flow resistance, compliant | 4 microphone |
| medium | 5 microphone (0.5 cc) | |
| high | closed, high flow resistance, stiff | 5 microphone (0.1 cc) |
In case of contradictory properties (i.e. a very small sample of an open material), it is recommended to give the sample size precedence over the material properties.
2. Perform a series impedance measurement
After selecting an initial configuration, perform a series impedance measurement, as described in Series impedance measurements.
3. Assess the quality of the measurement results
If using the 4 microphone method, perform the following checks:
- Plot the
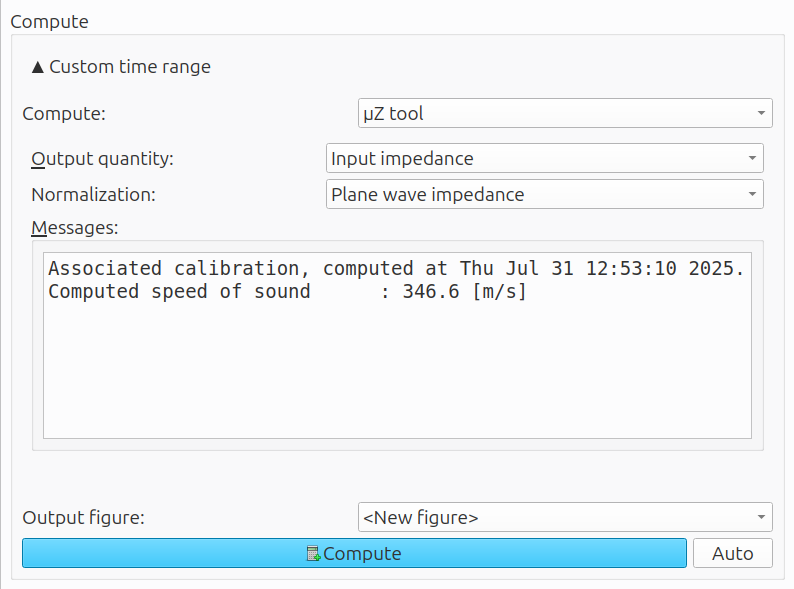
Input impedance, normalized w.r.t. the characteristic impedance and check if it isn't too high.- Select the
Analyzetab in ACME and use the settings shown below. - The normalized input impedance should not exceed 20 dB. If it does, switch to the 5 microphone method with the 0.5 cc back cavity.
- Select the
- As an additional check, plot the
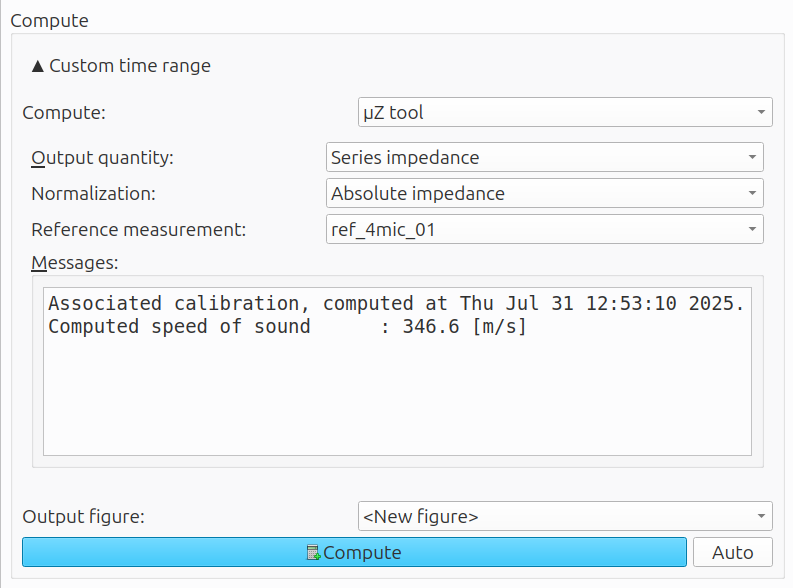
Series impedanceand check the results.- Use the settings as shown below.
- The normalization is arbitrary.
- Both the magnitude and phase plots should be smooth. Ragged data can indicate that the signal levels are close to the noise floor of the microphones, or that the impedance of the sample is too low to be measured. To identify the cause, try redoing the measurement with a higher signal level.
- Use the settings as shown below.
If using the 5 microphone method with the 0.5 cc back cavity, some of the data quality checks are performed automatically by ACME, while others need to be performed manually:
- If the software indicates that there is insufficient signal on the tip microphone, this indicates that the impedance of the sample is too high to be measured with this cavity size. If this error occurs, switch to the 0.1 cc back cavity.
- Plot the
Series impedance.- If the magnitude curves upwards at low (and in some cases high) frequencies, this indicates the impedance of the sample is too low to measure using this configuration. To check this, do the following:
- Plot the
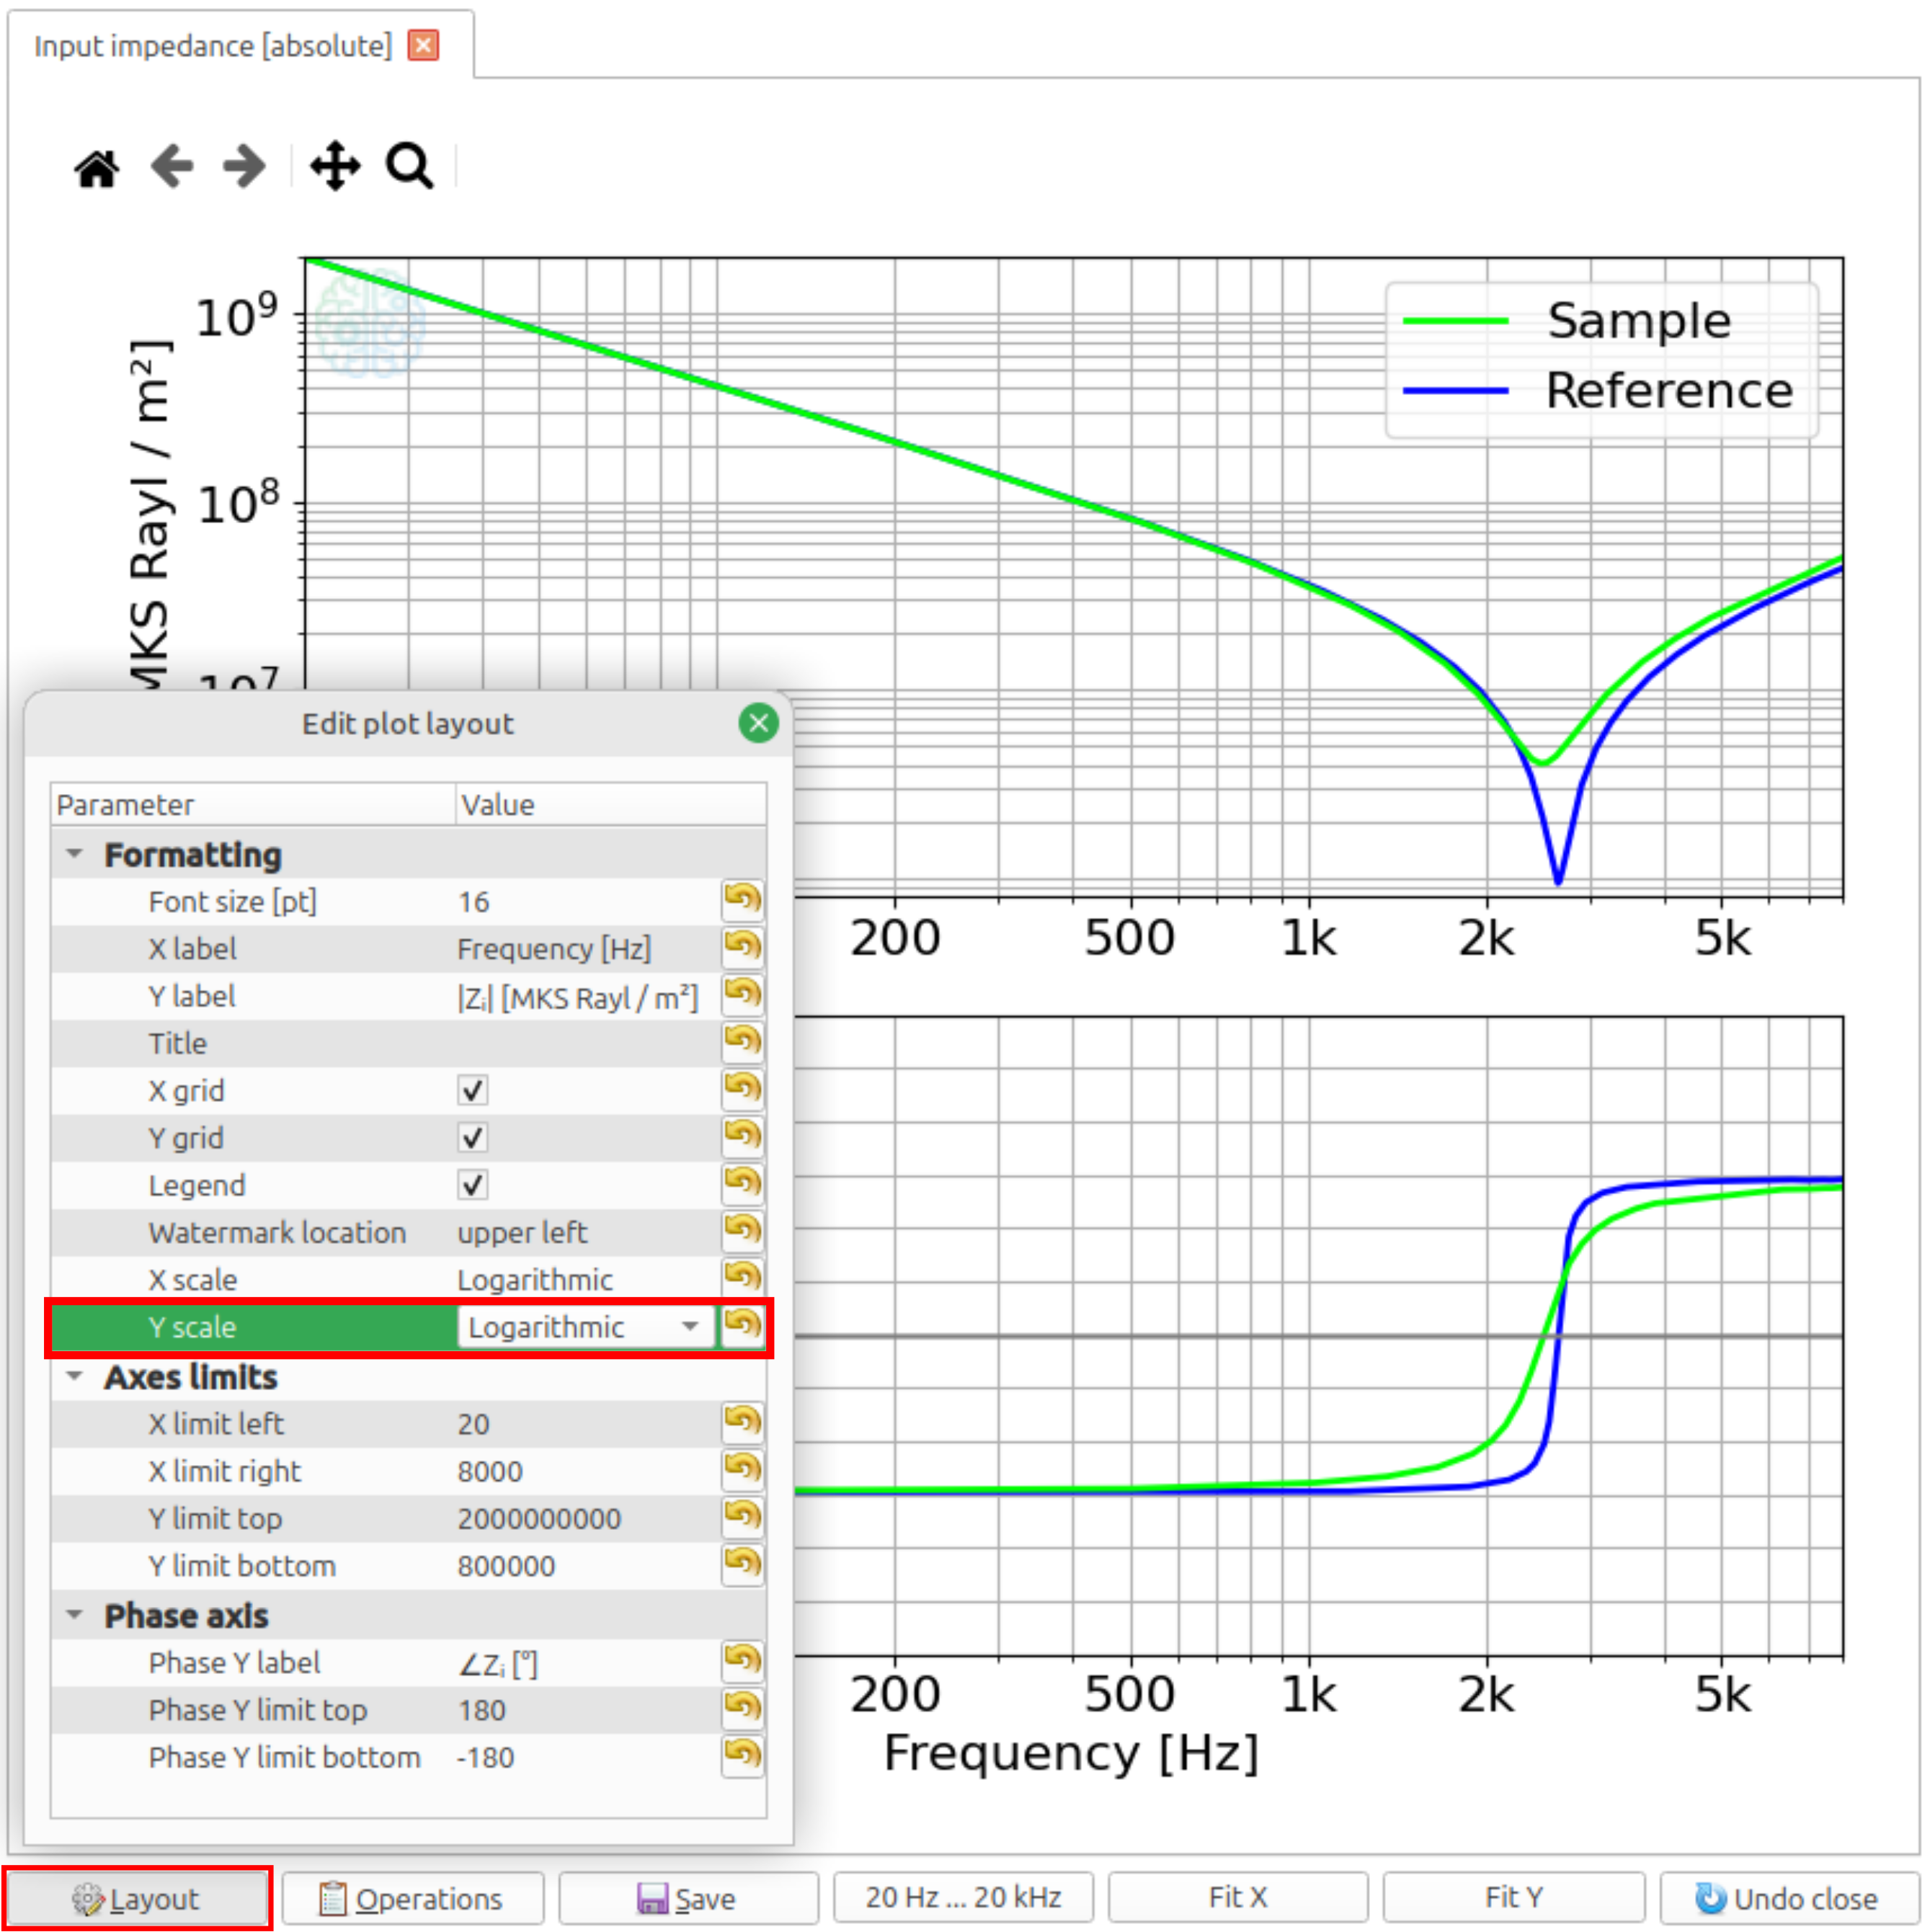
Input impedance, without normalization (Absolute impedance), of the SAMPLE measurement and its associated REFERENCE measurement, in the same figure. - Click
Layoutin the toolbar below the plot window and set theY scaletoLogarithmic(see screenshot below). - If the two lines overlap or are very close together for large parts of the frequency range, the impedance of the sample is too low. Switch to the 4 microphone method.
- Plot the
- If the magnitude curves upwards at low (and in some cases high) frequencies, this indicates the impedance of the sample is too low to measure using this configuration. To check this, do the following:
If using the 5 microphone method with the 0.1 cc back cavity the quality checks are similar to those for the 0.5 cc back cavity:
- If the software indicates that there is insufficient signal on the tip microphone, check whether the output levels of the signal generator are set correctly.
- If the signal generator was set correctly, or increasing the output level doesn't help, the impedance of the sample is too high to measure with the (current) µZ system. Please contact us to discuss the possibilities to increase the measurement range of your system.
- Plot the
Series impedance, as described above for the 0.5 cc back cavity.- If the magnitude plot curves upwards at low (and in some cases high) frequencies, plot the
Input impedancesas described above for the 0.5 cc back cavity.- If the two lines overlap or are very close together for large parts of the frequency range, the impedance of the sample is too low. Switch to the 0.5 cc back cavity. If the two lines overlap over the majority of the frequency range, consider switching to the 4 microphone method.
- If the magnitude plot curves upwards at low (and in some cases high) frequencies, plot the
Examples
Below are series impedance results for 3 different mesh materials. Their properties were chosen such that one of the configurations clearly yields the best results. All meshes were measured using all three configurations. These examples serve to illustrate how the measurement results are affected, if the wrong configuration is selected for a certain sample.
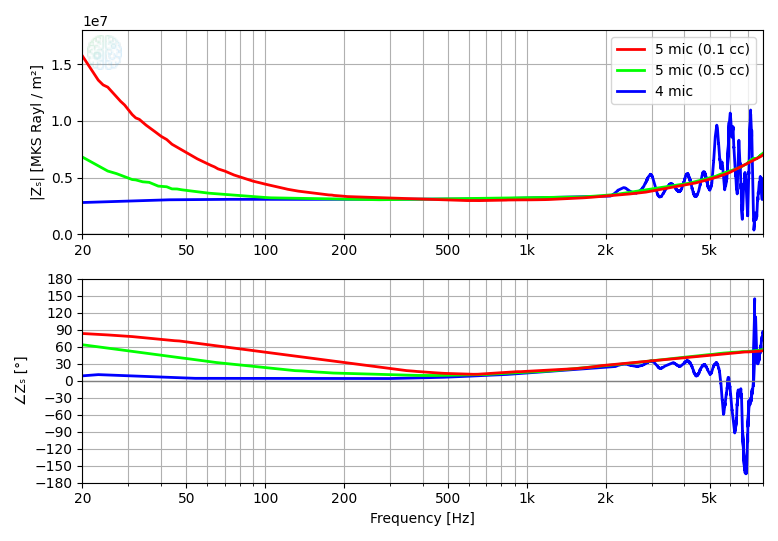
Low series impedance: constant 3 M Rayl/m²
This impedance is best measured with the 4 microphone method, at least for frequencies up to 2 kHz.
Above 2 kHz, the results get quite noisy. This is due to the fact that the sample has a 2 mm diameter and is mounted on a disk with a 2 mm diameter hole. The acoustic mass of this hole results in a significant input impedance (> 20 dB) above 2 kHz, which negatively affects the quality of the measurements.
The inaccuracies of the 5 microphone method for this impedance are mainly visible at low frequencies:
- The measured magnitude of the series impedance curves upwards for both back cavity sizes, indicating that the impedance of the back cavities is high relative to the impedance of the sample.
- The measured impedance for the 0.1 cc back cavity curves up much more and over a wider frequency range than that for the 0.5 cc cavity. This makes sense, since this smaller cavity has a significantly higher impedance.
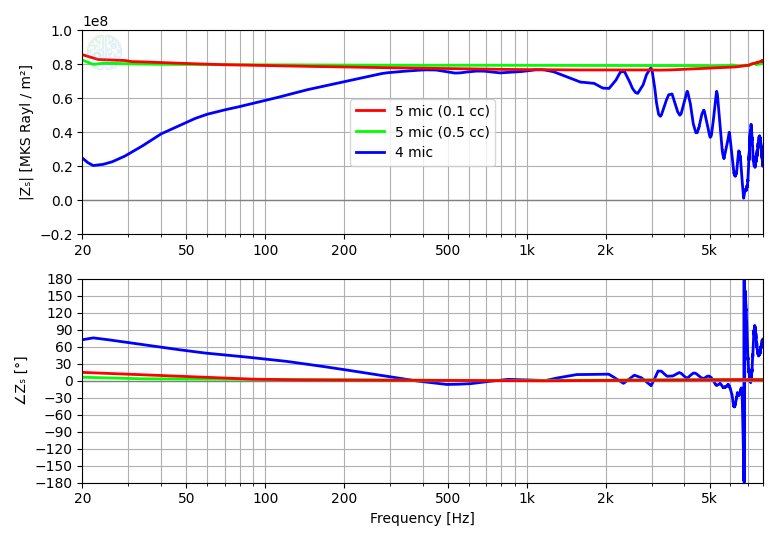
Medium series impedance: constant 80 M Rayl/m²
This impedance is best measured with the 5 microphone method using the 0.5 cc back cavity.
- The 4 microphone method yields ragged and largely inaccurate results. The impedance of the sample is too high for it too measure.
- The only range where the results are moderately accurate is between 400 Hz and 1200 Hz. However, even in this frequency range the results are not smooth.
- The 5 microphone method with the smaller 0.1 cc back cavity yields reasonably accurate results. However, the magnitude curves upwards at the low and high frequencies. Note that the deviation in magnitude at high frequencies is not accompanied by a change in phase, which indicates that it is not a physical phenomenon.
High series impedance: constant 920 M Rayl/m²
This impedance is best measured with the 5 microphone mode using the 0.1 cc back cavity.
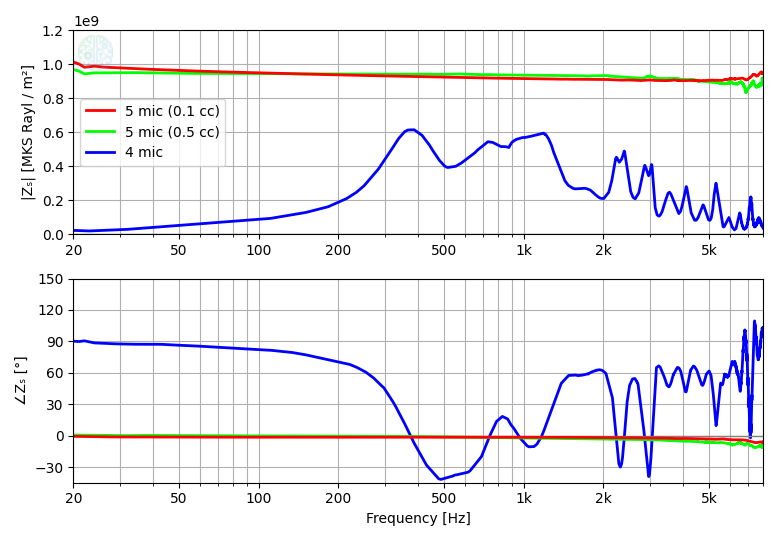
- The 4 microphone mode yields ragged, wildly inaccurate results. The impedance of the sample is much too high for it to measure.
- The 5 microphone mode with the larger 0.5 cc back cavity yields reasonably accurate results. The main inaccuracy for this configuration can be seen at high frequencies. Here the data gets noisier, due to the signal level at the tip microphone approaching the noise floor. The volume velocity through the sample is not large enough to build up a sufficient sound pressure level within the larger back cavity.
