Analyze tab
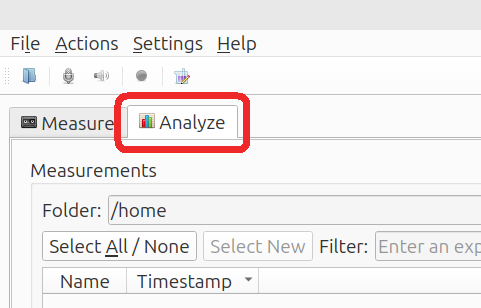
Access the Analyze tab by clicking its tab:

Overview
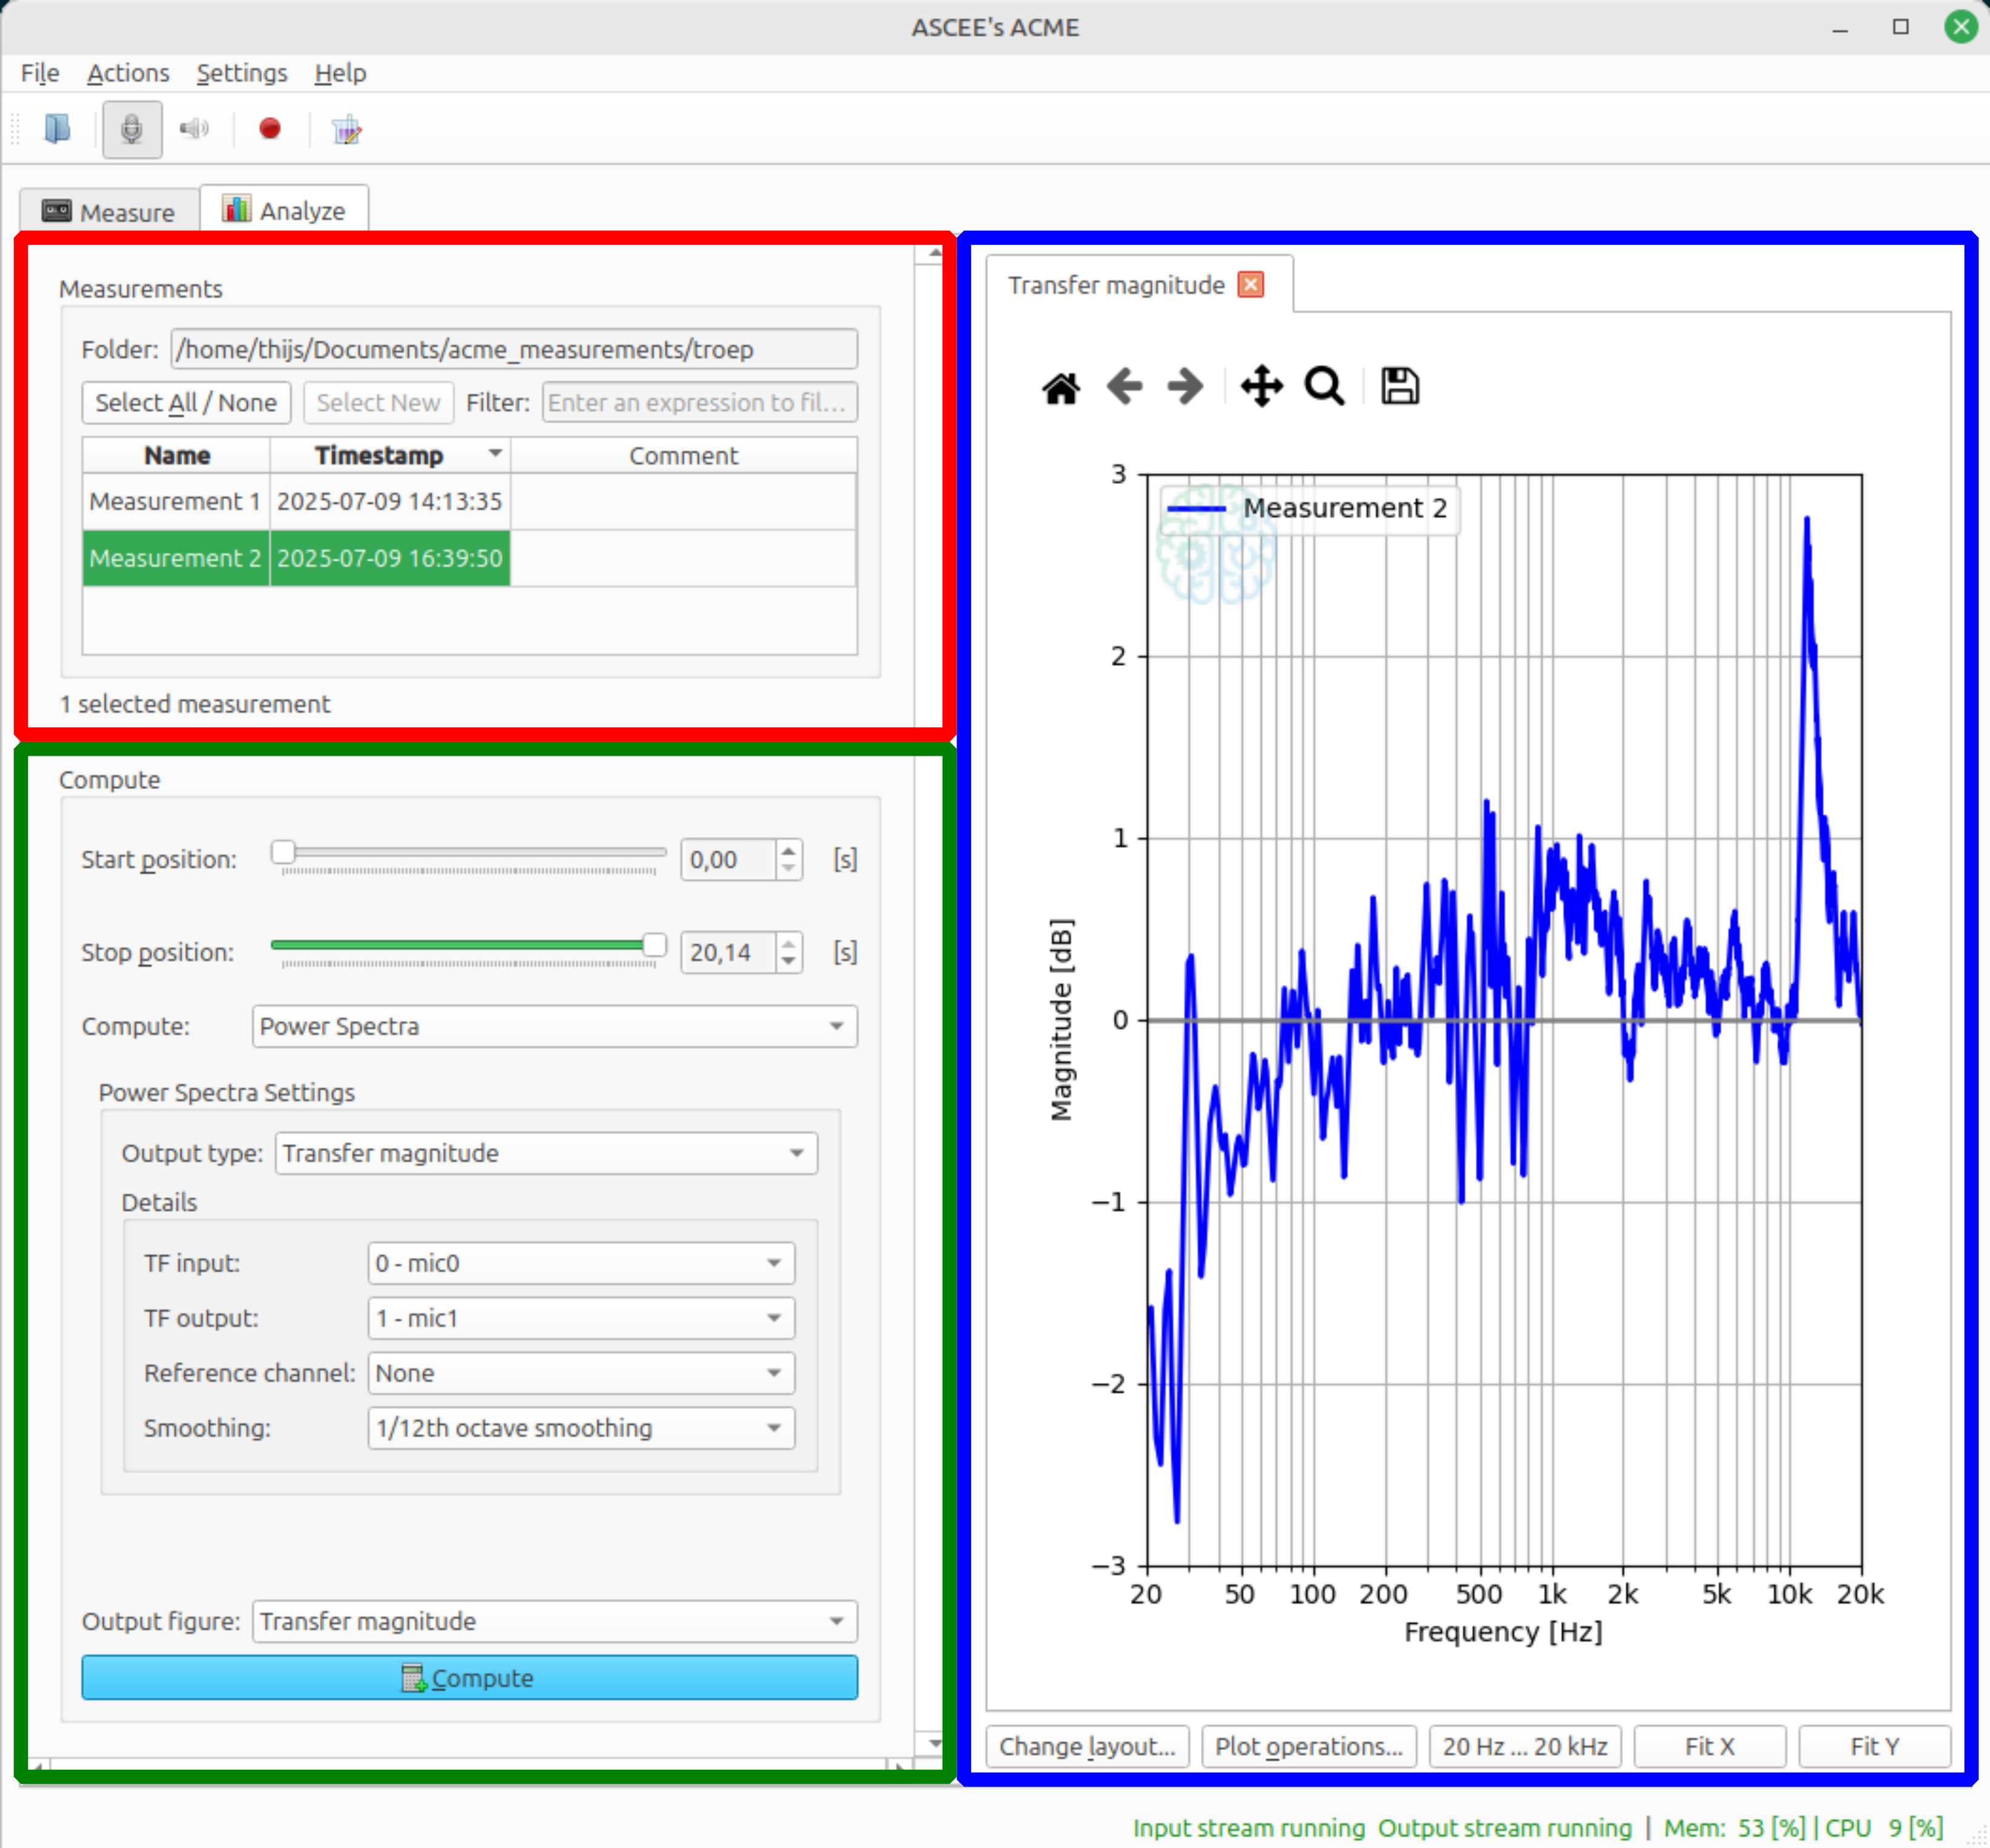
The analyze tab is divided into three sections:
- Measurement list: red
- Compute: green
- Plot area: blue

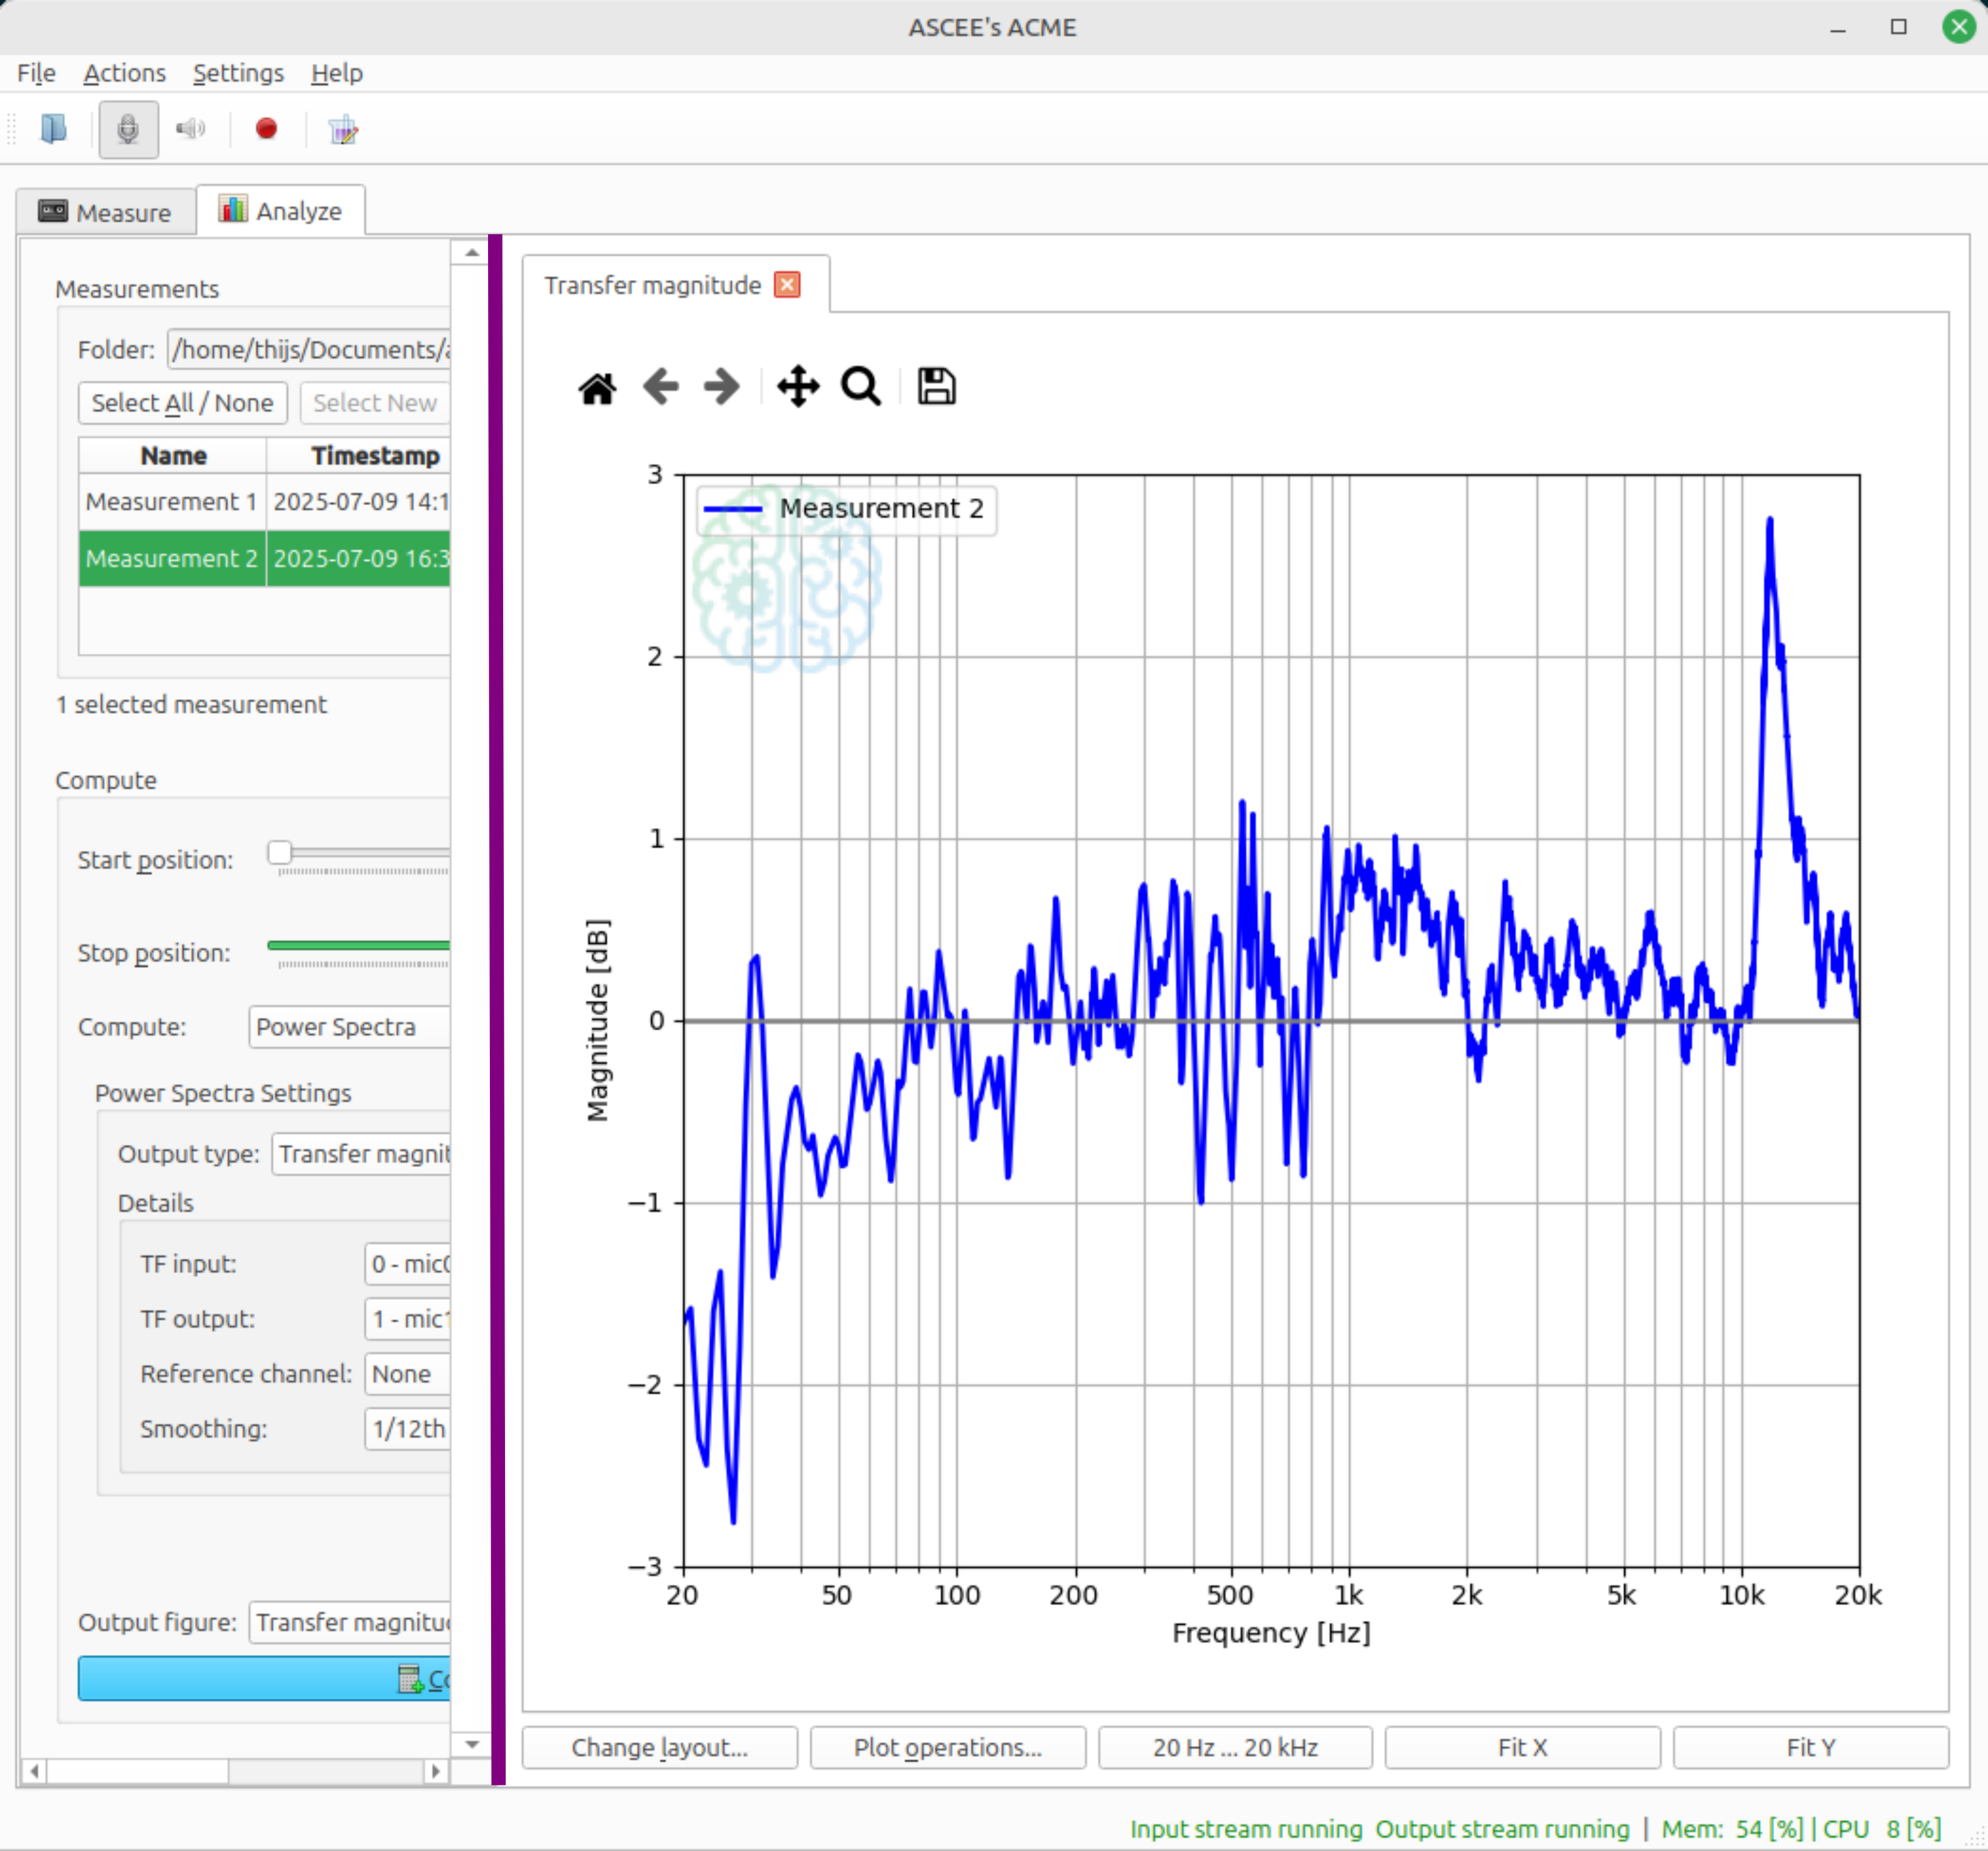
The vertical divider (purple line in the image below) between the computation settings (left) and plot area (right) is draggable. If it is dragged to far to the left some of the options may become (partially) obscured.

Workflow
To plot one or more measurements, select them from the measurement list, pick the desired computation settings and click Compute. A plot is created in the plot area. Only compatible measurements can be plotted simultaneously. In practice, this means that they must share the same DAQ Configuration.
The various sections are explained in the corresponding subchapters.
tip
If the Compute button is disabled, it likely means that the measurements you selected are not compatible. In this case, try plotting one measurement at a time.